Kaplan-Meier estimator
From Wikipedia, the free encyclopedia
<!-- start content -->
The Kaplan-Meier estimator (also known as the product limit estimator) estimates the survival function from life-time data. In medical research, it might be used to measure the fraction of patients living for a certain amount of time after treatment. An economist might measure the length of time people remain unemployed after a job loss. An engineer might measure the time until failure of machine parts.
A plot of the Kaplan-Meier estimate of the survival function is a series of horizontal steps of declining magnitude which, when a large enough sample is taken, approaches the true survival function for that population. The value of the survival function between successive distinct sampled observations ("clicks") is assumed to be constant.
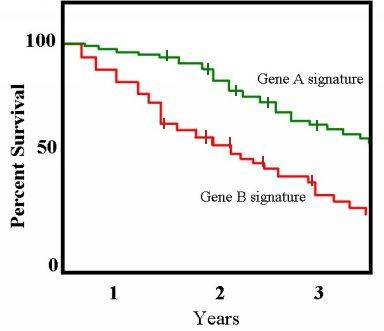
An example of a Kaplan-Meier plot for two conditions associated with patient survival
An important advantage of the Kaplan-Meier curve is that the method can take into account "censored" data — losses from the sample before the final outcome is observed (for instance, if a patient withdraws from a study). On the plot, small vertical tick-marks indicate losses, where patient data has been censored. When no truncation or censoring occurs, the Kaplan-Meier curve is equivalent to the empirical distribution.
In medical statistics, a typical application might involve grouping patients into categories, for instance, those with Gene A profile and those with Gene B profile. In the graph, patients with Gene B die much more quickly than those with gene A. After two years about 80% of the Gene A patients still survive, but less than half of patients with Gene B.
[edit] Formulation
Let S(t) be the probability that an item from a given population will have a lifetime exceeding t. For a sample from this population of size N let the observed times until death of N sample members be
Corresponding to each ti is ni, the number "at risk" just prior to time ti, and di, the number of deaths at time ti.
Note that the intervals between each time typically will not be uniform. For example, a small data set might begin with 10 cases, have a death at Day 3, a loss (censored case) at Day 9, and another death at Day 11. Then we have (t1 = 3,t2 = 11), (n1 = 10,n2 = 8), and (d1 = 1,d2 = 1).
The Kaplan-Meier estimator is the nonparametric maximum likelihood estimate of S(t). It is a product of the form
When there is no censoring, ni is just the number of survivors just prior to time ti. With censoring, ni is the number of survivors less the number of losses (censored cases). It is only those surviving cases that are still being observed (have not yet been censored) that are "at risk" of an (observed) death.
There is an alternate definition that is sometimes used, namely
The two definitions differ only at the observed event times. The latter definition is right-continuous whereas the former definition is left-continuous.
Let T be the random variable that measures the time of failure and let F(t) be its cumulative distribution function. Note that
Consequently, the right-continuous definition of may be preferred in order to make the estimate compatible with a right-continuous estimate of F(t).
[edit] Statistical considerations
The Kaplan-Meier estimator is a statistic, and several estimators are used to approximate its variance. One of the most common such estimators is Greenwood's formula:
In some cases, one may wish to compare different Kaplan-Meier curves. This may be done by several methods including:
<!--
NewPP limit report
Preprocessor node count: 216/1000000
Post-expand include size: 3500/2048000 bytes
Template argument size: 1218/2048000 bytes
Expensive parser function count: 1/500
--><!-- Saved in parser cache with key enwiki:pcache:idhash:3168650-0!1!0!default!!en!2 and timestamp 20090406062601 -->
<!-- end content -->
分享到:


相关推荐
本文研究了在存在独立权利审查的竞争风险背景下,Nelson-Aalen和Kaplan-Meier估计的渐近正态性。 为了证明我们的结果,我们使用罗贝勒多定理,这使将中心极限定理应用到某些类型的mar上成为可能。 根据获得的结果,...
绘制生存函数的 Kaplan-Meier 估计生存时间是测量从定义的起始点到给定事件发生的随访时间的数据,例如从缓解期开始到结束的时间或从疾病诊断到死亡的时间。 通常不能应用标准的统计技术,因为基础分布很少是正态...
KMWin(适用于Windows的Kaplan-Meier)是一种方便的工具,可用于以图形方式表示Kaplan-Meier生存时间分析的结果。 该程序基于统计软件环境R,并提供易于使用的图形界面。 作为简介,请参见...
此 GUI 基于以下 matlab 代码: http : //www.mathworks.com/matlabcentral/fileexchange/22293-kmplot 档案里有针对中国人的介绍。
然后,我们估算了生存概率,并将其与常用的非参数生存时间非参数Kaplan-Meier生存分析进行了比较。 两种方法的生存概率估计值的比较显示,与Kaplan-Meier相比,参数化方法的生存概率估计值更好。 参数生存分析更加...
josh-kaplan-intro-matlab-octave-archive-refs-heads-master.zip
交互式知识管理交互式 Kaplan Meier 生存图
方法:采用免疫化学方法检测肿瘤中SPARC的表达,并通过Kaplan-Meier和Cox比例风险模型分析SPARC对预后的影响。 结果:在肿瘤和间质中识别到的SPARC阳性表达分别为31.33%和64.66%。 SPARC在基质中的表达与分化,...
matlab开发-Kaplanmeierforrightandor leftandor intervalcendeddata(卡普兰迈耶或左方和或时间审查数据)。通过r为左/右/区间截尾数据提供产品极限估计量(kaplan-meier)。
多元分析显示,铁蛋白水平组与全因死亡率或心血管(CV)事件之间无显着相关性,Kaplan-Meier分析显示3个铁蛋白水平组之间全因死亡率和CV事件发生率无显着差异。 然而,多变量分析显示,年龄,CRP水平和既往CV病史与...
然后,我们使用Kaplan-Meier生存分析方法绘制了整体的留存曲线,从中可以看出会员的留存率随着入会月数的增加逐渐下降,这提醒我们需要关注新会员的留存情况。 接着,我们对不同因素进行了分析,比如会费支付方式、...
这本书是关于一个web开发框架Django的,它将节省你大量的时间,并且使你的web开发充满乐趣。通过Django,你可以建立一个高性能的web应用而只花费最小的消耗。6 从好的方面来看,Web 开发激动人心且富于创造性;...
matlab开发-KMplot。绘制生存函数的Kaplan-Meier估计
生存分析模型中著名的Kaplan-Meier估计(简称KM估计)的原文
13.2 Kaplan-Meier过程 13.2.1 界面说明 13.2.2 结果解释 13.3 Cox Regression过程 13.3.1 界面说明 13.3.2 结果解释 13.4 Cox w/Time-Dep Cov过程 13.4.1 界面说明 13.4.2 结果解释 §13.3 Cox Regression过程 上面...
13.2 Kaplan-Meier过程 13.2.1 界面说明 13.2.2 结果解释 13.3 Cox Regression过程 13.3.1 界面说明 13.3.2 结果解释 13.4 Cox w/Time-Dep Cov过程 13.4.1 界面说明 13.4.2 结果解释 对于急性病的疗效考核,一般可以...
Kaplan-Yorke分形维数 冲洗时间分配 安装 下载此存储库。 在您的工作笔记本中,确保lagrange2d.wl在路径上。 然后可以按以下方式导入该软件包: SetDirectory[NotebookDirectory[]] << lagrange2d.wl 功能与...
经皮椎体成形术是一种微创手术,包括用骨水泥填充骨折的椎体,以减轻疼痛和... 这篇综述的目的是根据X光片,Kaplan-Meier估计指数以及导致邻近水平椎体压缩性骨折的因素,评估经皮椎体成形术后邻近水平椎体压缩性骨折。
matlab开发-生命函数的估计。一个简单的用于Kaplan-Meier生存函数估计的图形用户界面。
在肿瘤学的某些临床应用中,不可能进行随机,双重武装和双盲试验。 在设备应用中,双盲条件是不现实的,并且由于没有参考... 数据分离的基本思想是通过多Weibull拟合对非参数Kaplan-Meier生存模式进行适当的参数化。